The same problem. Two completely different afternoons.
Whether a teammate wrote it or an AI agent did, code still has to be understood before you can trust it. See what changes when you stop grepping and start asking.
Fast to write. Easy to miss what it broke.
Catch what the agent missed — before you hit merge.
From code change to confidence.
Everything you need to understand a codebase.
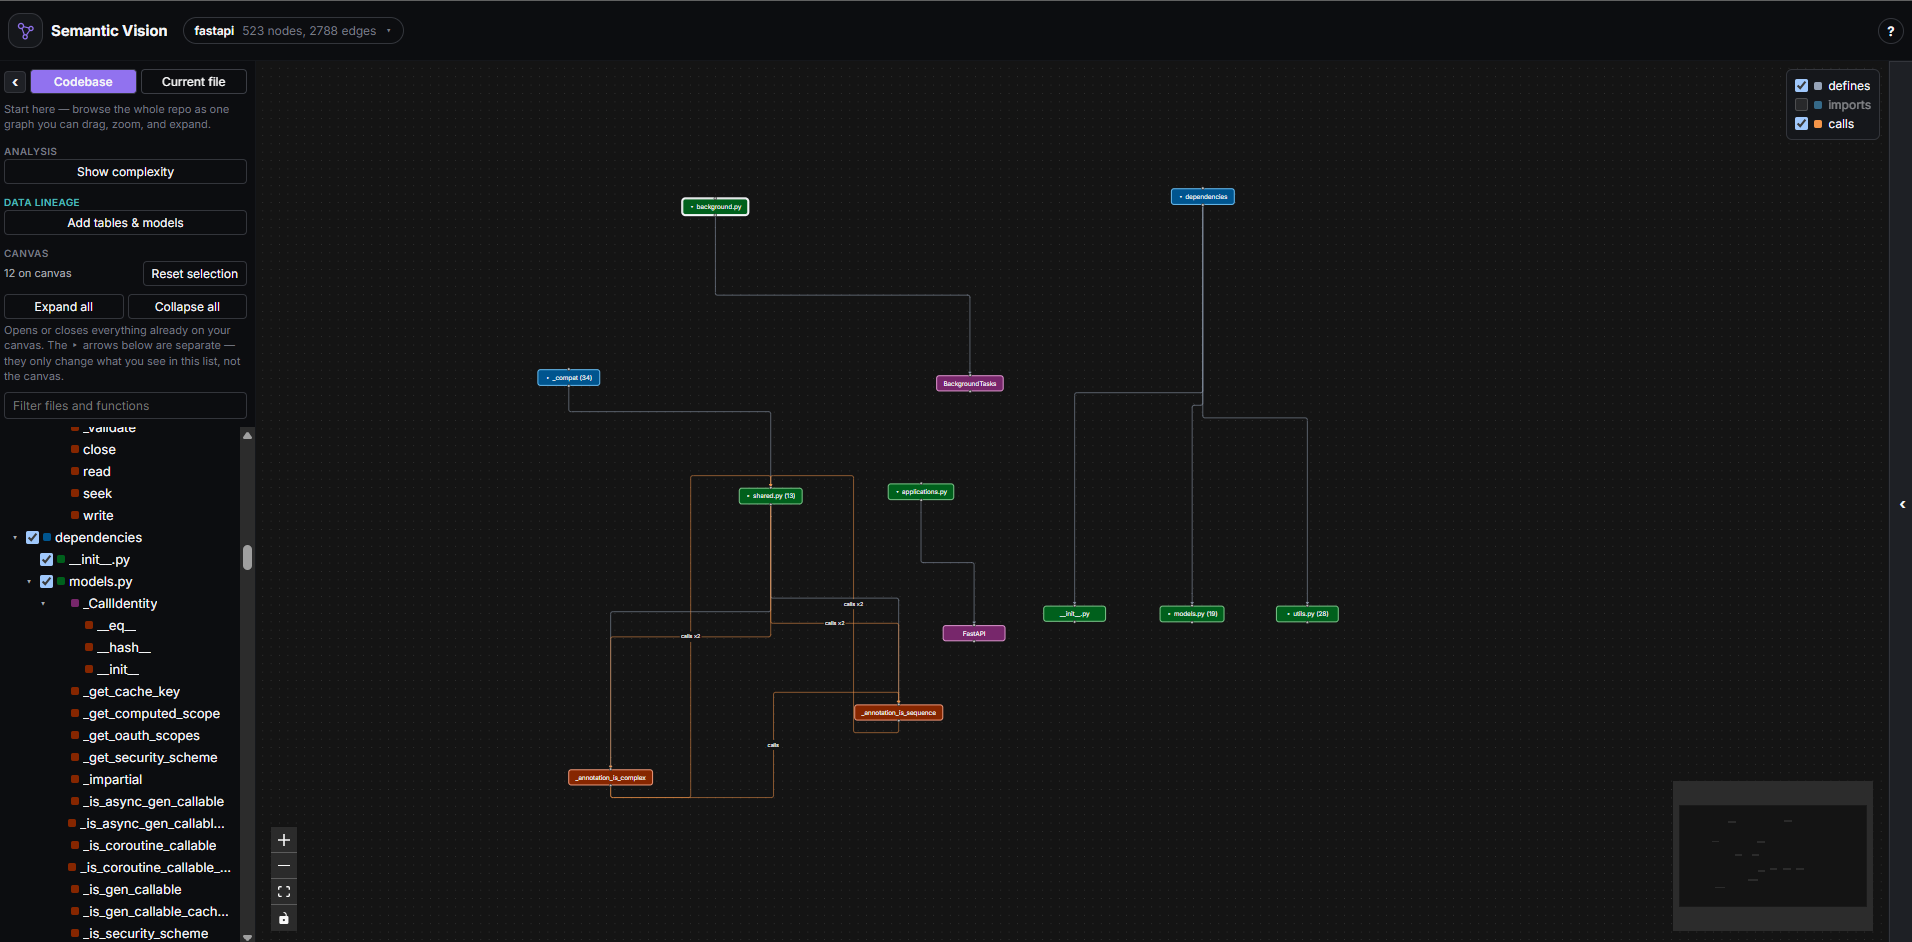
See the whole codebase as one map
Every directory, file, class, and function as a zoomable, color-coded graph with call/import/defines edges — structure that would otherwise take an hour of grepping to piece together by hand. Real-time search across the whole repo, and your dragged layout persists automatically.
Don't just review what changed. Review what it did to the codebase.
Complexity and blast radius tell you where a change matters. Coverage tells you whether that area is actually tested. Git history tells you which code keeps changing. Semantic Vision brings those signals together.
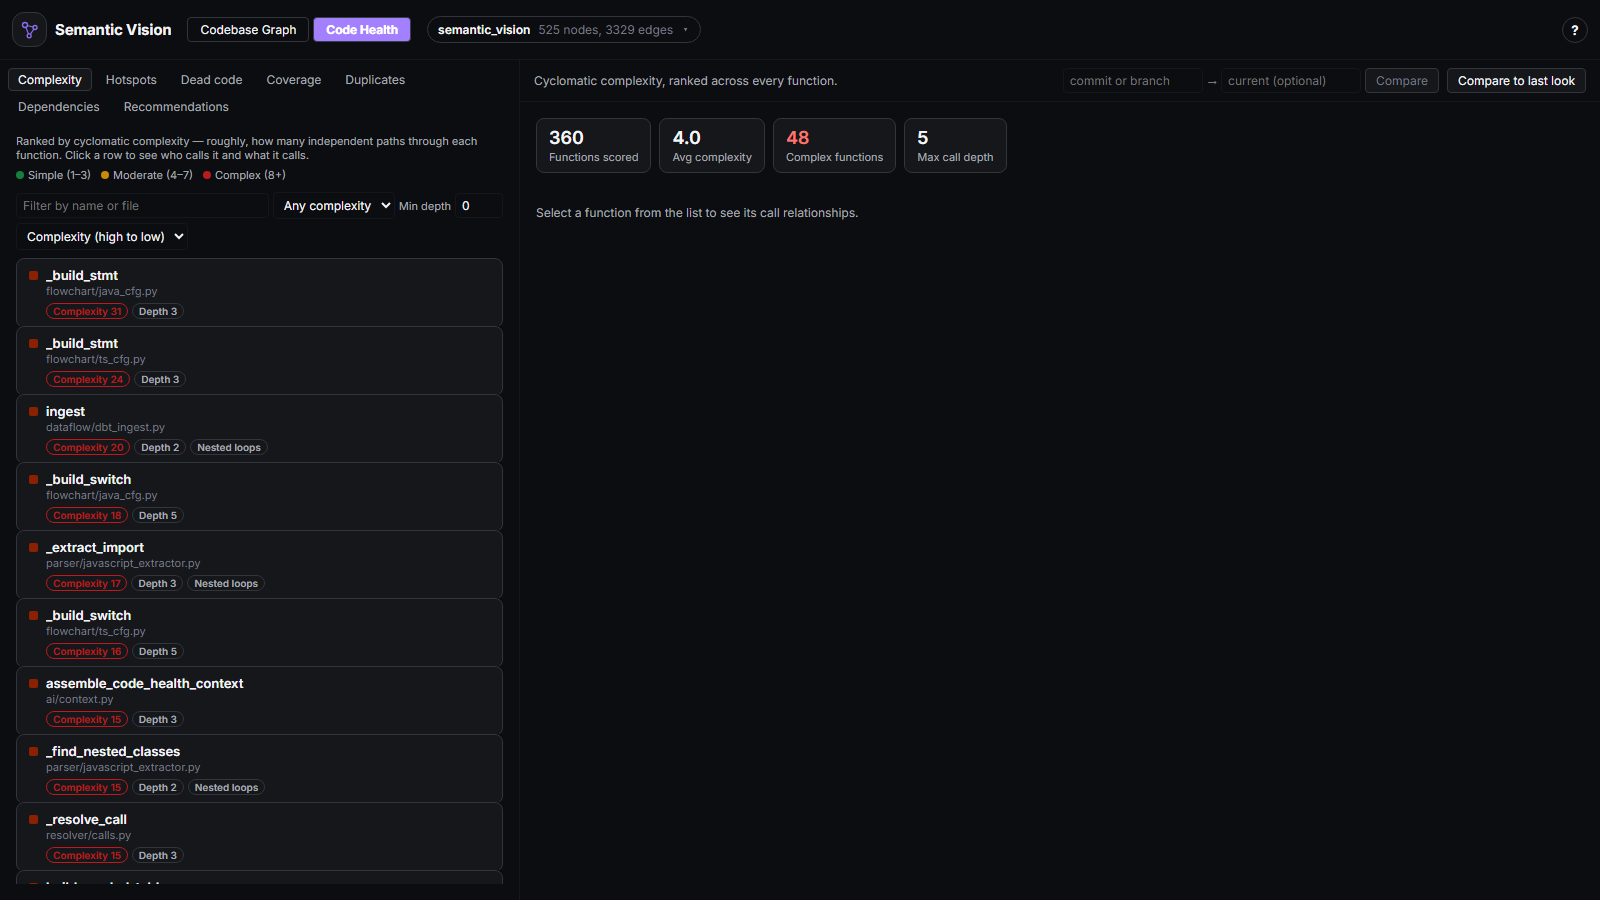
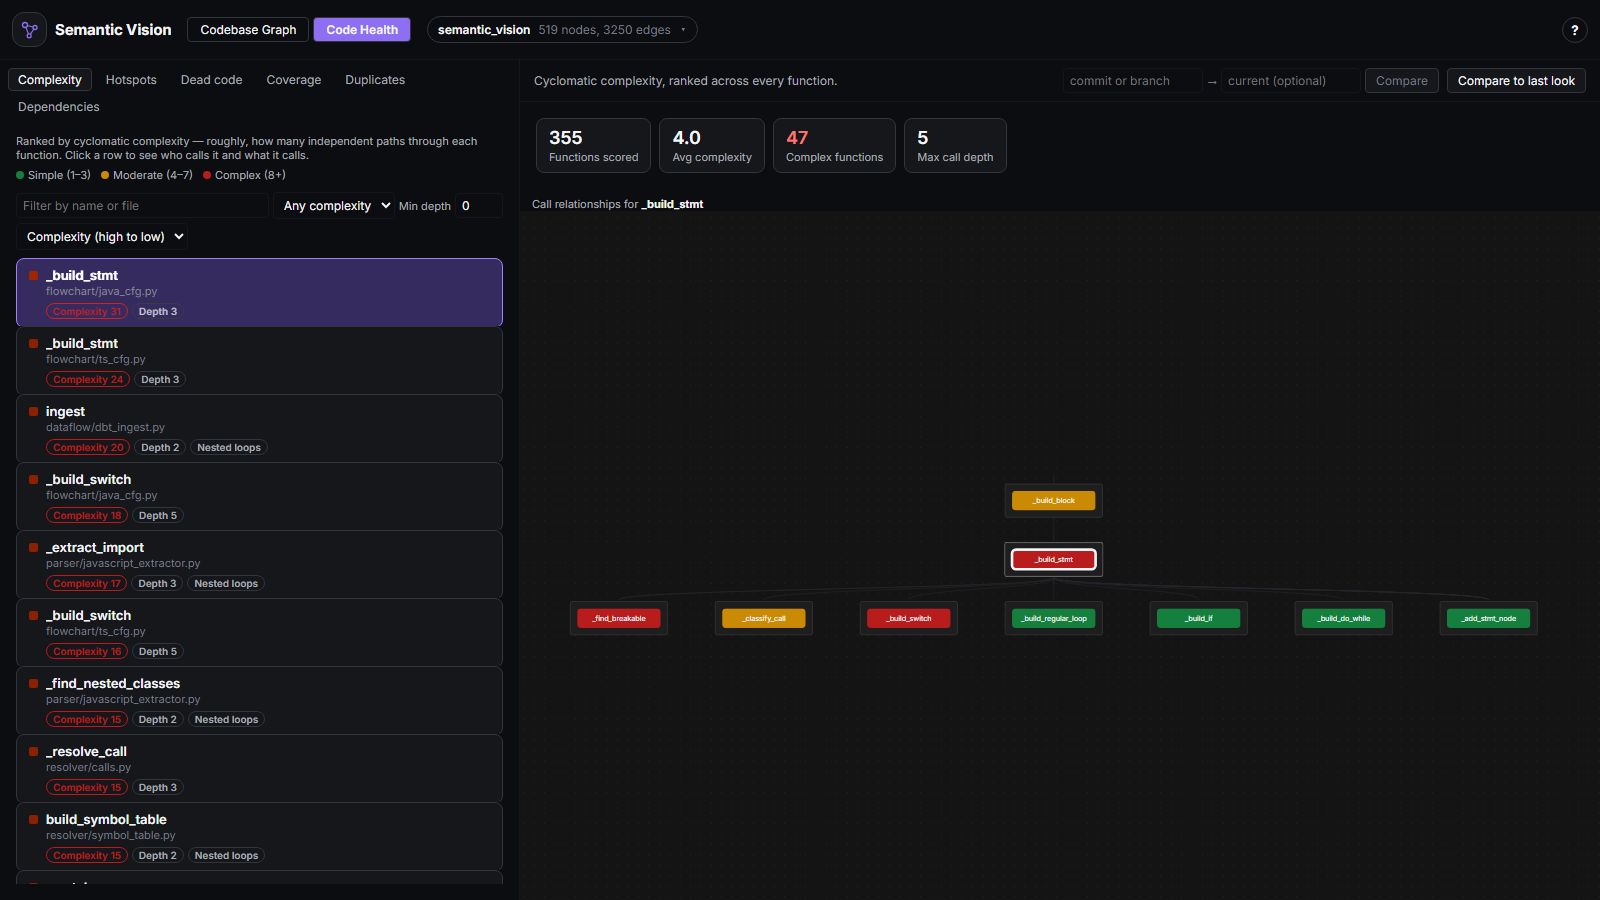
Every function ranked by cyclomatic complexity, computed from a real AST walk — decisions, boolean chains, comprehensions, and nested loops, not a line-count guess.
Your code doesn't exist in isolation.
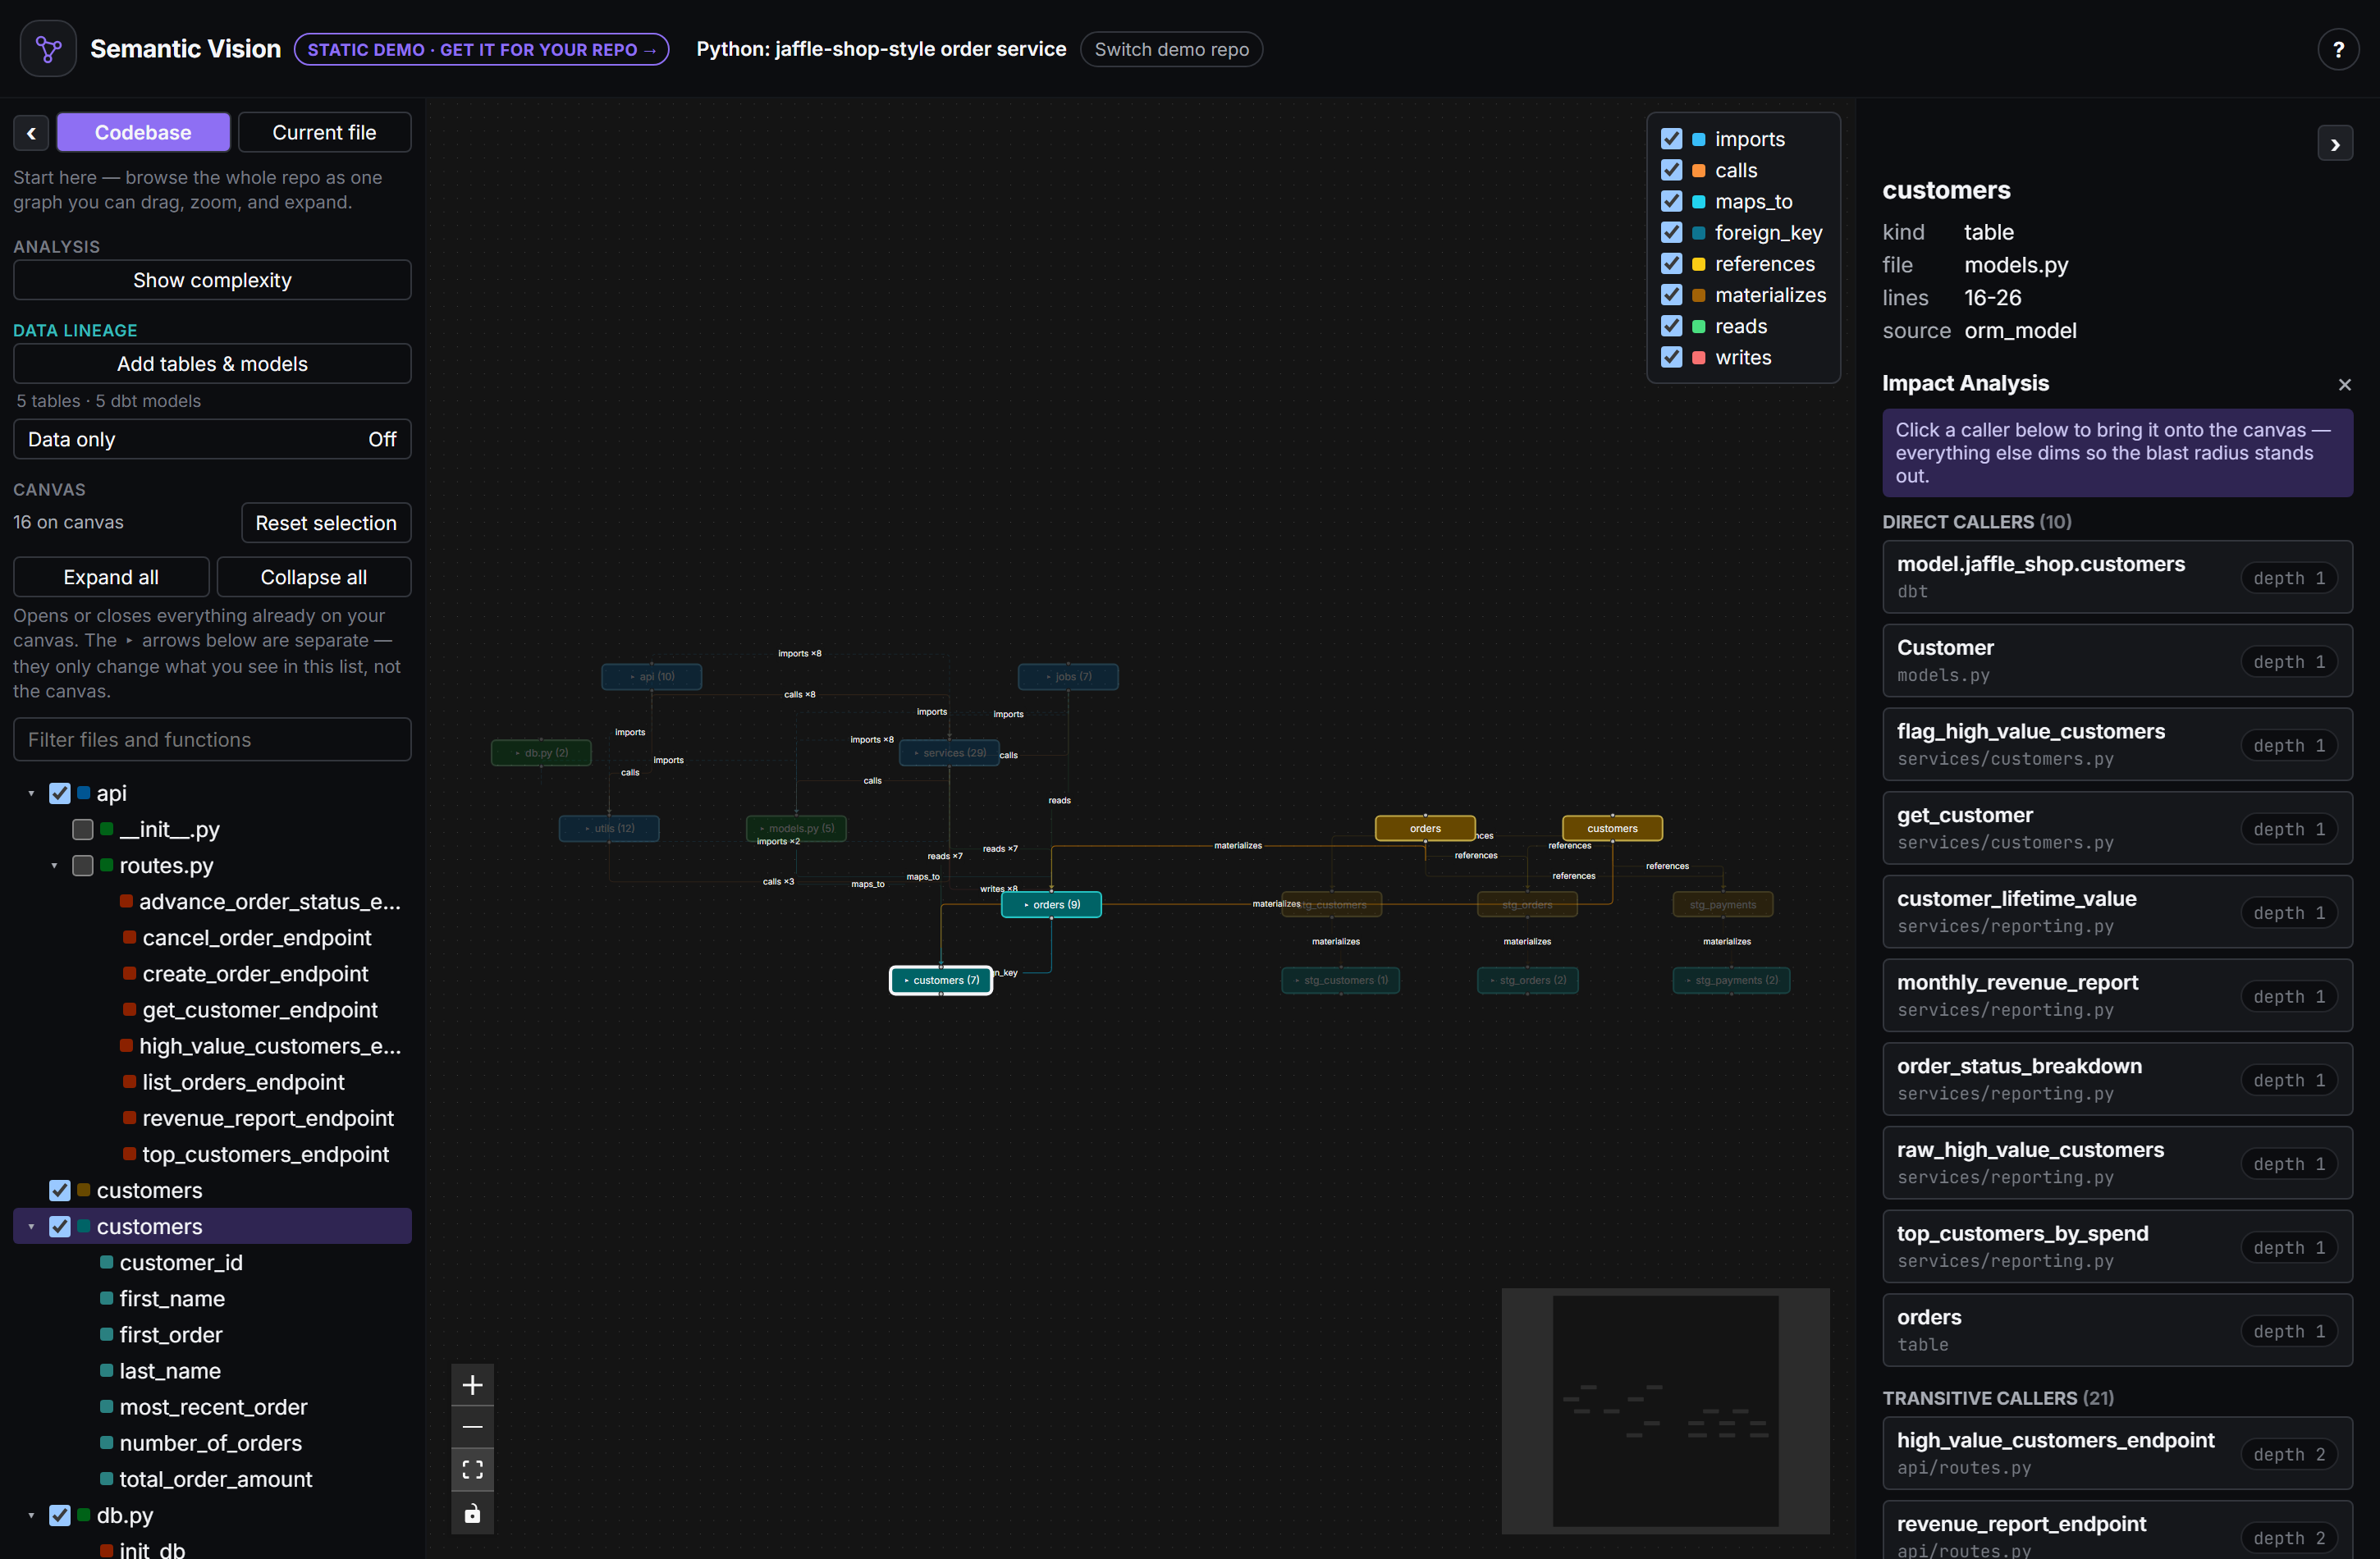
Three sources feed the same graph, reconciled by table name, so the same table only ever shows up once.
Detected automatically, or connected explicitly
Three sources feed the same graph, reconciled by table name — the same table only ever shows up once.
SQLAlchemy models
Detected automatically on every parse — no setup
dbt
Point it at a manifest.json you already have
A live database
Read-only connection, to see schema drift
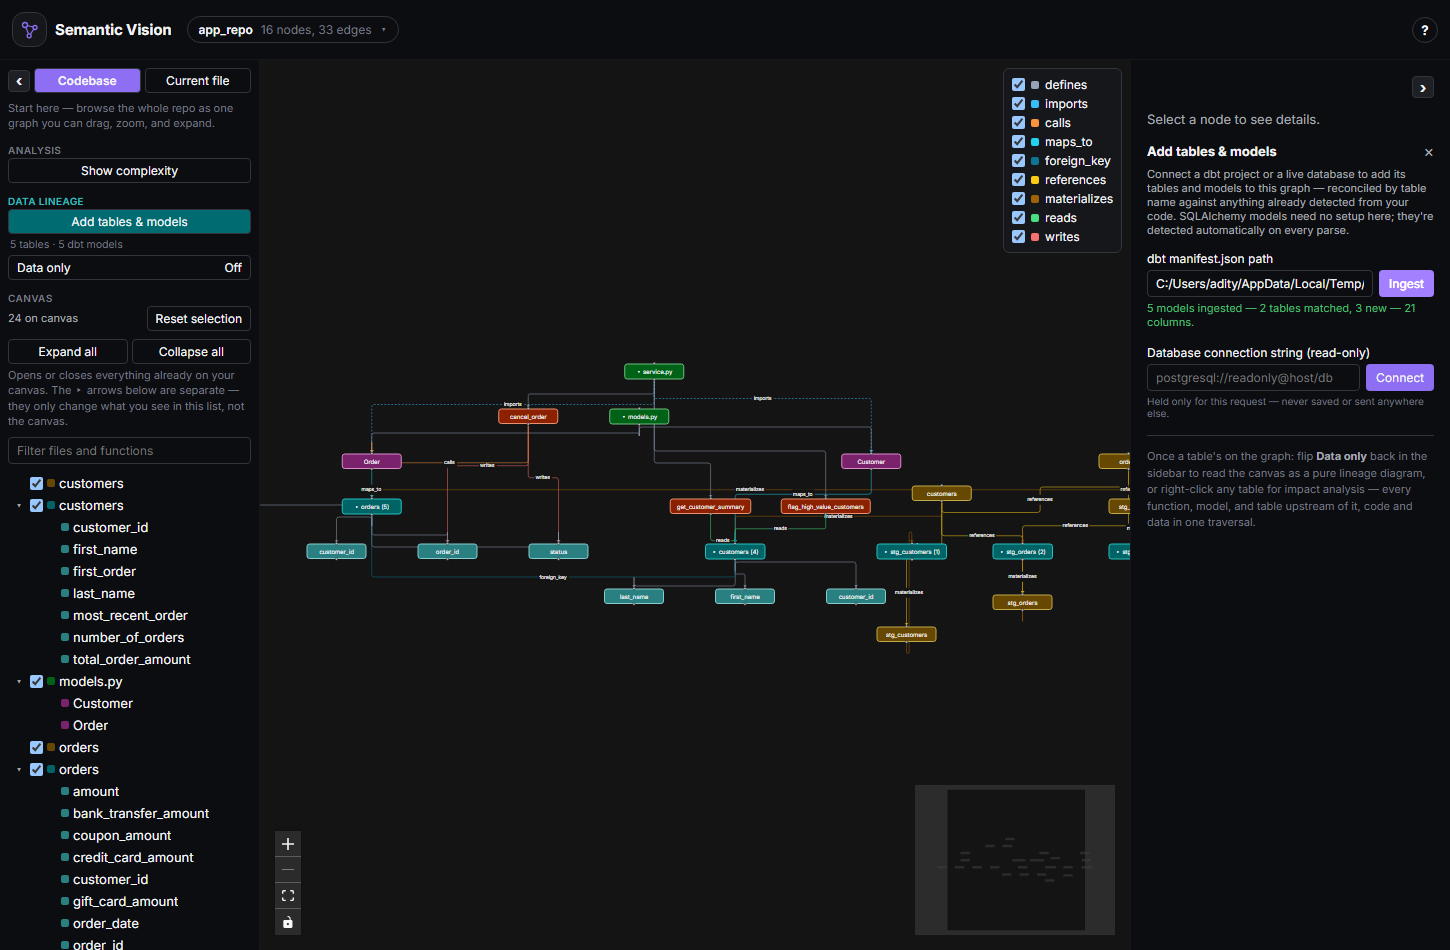
Impact analysis that crosses code and data in one traversal
Flip Data only to dim everything that isn't a table, a dbt model, or code that reads/writes one — the same graph, filtered to a lineage-only reading.
Right-click a table or a single column exactly like a function to see every function, model, and table upstream of it — the way to answer "what actually breaks if I rename this column, drop this table, or change what this dbt model materializes" before doing it, not after.
Your AI agent can see the map too.
Coding agents already know how to edit code. The problem is understanding the structure around it. Semantic Vision exposes its analysis as MCP tools — tap one to see what it answers.
get_graph(path, max_nodes)
The full parsed structure — every node and edge in the repo, truncated past max_nodes so a single call can't flood an agent's context.
parse_repo runs once per repo, first. Works with Claude Code, Cursor, Claude Desktop, or any other MCP-compatible agent.
Don't leave VS Code to understand your code.
Install the Semantic Vision extension and get the full experience directly beside your code.
No separate browser tab. No Python or uv installation required.
The backend ships bundled with the extension — open any Python, JS/TS, or Java repo and get the full graph, impact analysis, Code Health, flowcharts, AI docs, and lineage in a panel next to your code.
Fast, local, and private.
Semantic Vision performs its code analysis locally. Your code is never executed as part of static analysis.
Dependency vulnerability scanning (osv.dev) and AI providers (Ollama, OpenAI, Anthropic) are the only features that reach the network — both explicitly opt-in.
Works across your stack.
| Feature | Python | JavaScript / TypeScript | Java |
|---|---|---|---|
| Call graph — imports, classes, functions, calls | ✓ | ✓ | ✓ |
| Impact analysis (upstream callers, cycle detection) | ✓ | ✓ | ✓ |
| Code Health (complexity, hotspots, dead code, coverage, duplicates, dependencies, AI recommendations) | ✓ | ✓ | ✓ |
| Execution flowcharts | ✓ | ✓ | ✓ |
| AI-generated documentation | ✓ | ✓ | ✓ |
| Code-to-data lineage (SQLAlchemy, dbt, live DB) | ✓ | — | — |
| Docker packaging / one-command setup | ✓ | ✓ | ✓ |
Real repositories. Real performance.
Not this project's own fixtures — one large, popular repo per supported language.
| Language | Repo | Files | Parse — cold | Parse — warm | Render in browser |
|---|---|---|---|---|---|
| Python | fastapi/fastapi | 1,138 | 23.25s | 4.08s | 7.20–7.84s |
| JavaScript | three.js | 752 | 29.33s | 1.98s | 4.88–5.01s |
| TypeScript | nestjs/nest | 1,907 | 39.68s | 2.48s | 6.85–6.88s |
| Java | google/guava | 615 | 9.83s | 2.52s | 4.73–7.63s |
Three ways to try it — pick one
Try the live demo
Explore three real, precomputed repos — Python, JavaScript, and Java — right in your browser. No backend, no account, nothing to set up.
Open the demo →VS Code extension
Install from the Marketplace and open any Python, JS/TS, or Java repo. The backend ships bundled — no Python or Node toolchain required.
View on Marketplace →Run it locally, or via Docker
Clone the repo and run the backend + frontend yourself, or a single docker compose up --build — both fully documented.
Pick up exactly where you left off
Dragged layout, saved docs, and analysis state persist locally and restore instantly. Save location defaults to the repo's .git root, auto-detected even from a scoped-down subfolder.
What's under the hood
A FastAPI backend statically parses your code — Python's own ast, tree-sitter for JS/TS and Java. Code is never executed.